Last week, nerdy baseball fans across the country pulled up the 2014 Playoff Odds on Fangraphs.com to check the status of the American and National League pennant races. Since it was near the end of the season, most of the teams had either a zero percent chance of making the playoffs or a 100 percent chance. However, there were a few teams whose fate remained unclear.
For instance, the Pirates had a 15 percent chance of winning their division over the first place Cardinals, according to the simulator. Likewise, the Indians had 0.5 percent chance of making the playoffs, needing to jump over two of three teams -- the Athletics, Royals and Mariners -- to claim the last wild card spot in the AL.
Neither of these events occurred. Now that the regular season is in the books, we know that the Pirates fell short of the Cardinals by two games and instead captured the first Wild Card spot. The Indians missed the playoffs entirely. Now that we know the true outcomes of the 2014 MLB season, this is a perfect time to take a look at the projection systems that we have been watching all season.
People often do not understand why the supposedly best projection systems and simulators tend to be so centered toward the average. PECOTA, one of the most advanced baseball projection systems, for instance, predicted before the season that no one would hit more than 36 home runs this year (three players ended up hitting more than 36, and two more finished with exactly 36). Similarly, FiveThirtyEight.com was criticized for being very bearish on European teams in their 2014 World Cup simulation (Germany won the World Cup). The Indians had no chance of making the playoffs last week based on any logical observation, yet the simulator still gave Indians fans a bit of hope.
The accuracy of a projection system is measured by Mean Squared Error (MSE) or Root Mean Squared Error (RMSE), the square root of MSE. MSE is simply bias squared plus variance squared. In statistics, bias is the difference between the expected value of the estimate and the real number we try to predict. When the difference between the two is zero, the estimate is unbiased. Variance measures how much the estimate is spread out. According to Neil Paine and Ritchie King of FiveThirtyEight.com, Las Vegas’ over/under for baseball teams’ records produced an RMSE of about plus-or-minus 9 wins at the start of the season, and most other baseball projection systems get similar results for minimizing RMSE.
We like to think of outcomes for sports discretely. A team either makes the playoffs or not. We tend to predict whichever of the discrete outcomes is likeliest. Most of the time, the Indians will not make the playoffs, and it is quite reasonable to predict that they will not. Whenever the Indians do not make the playoffs, we will be correct 100 percent of the time, with no error. Those rare times the Indians do make the playoffs, we will be correct zero percent of the time.
Projection systems and simulators try to minimize RMSE. While the simulator or projection system will often be more wrong than the educated fan, we cannot neglect the times the simulator correctly identifies that a team still has a chance, despite the fact that fans and talking-heads have written that team off. The Colorado Rockies in 2007 won 14 of their last 15 games of the season to scrape into the playoffs (helped by an epic collapse by the Padres). The Indians just last season won their last 10 games to sneak into the playoffs. We would get those predictions wrong 100 percent of the time by just guessing who makes the playoffs and choosing the most reasonable team. The simulator is going to be off a lesser percent of the time (only 99.5 percent now for the Indians). On average, our projections and a simulator’s projections will get similar bias results. The simulator has a smaller variance, though, since it is less far off when it is wrong, and therefore has a smaller mean squared error. This is why these systems are so useful.
With three games left in the season, Cleveland needed to win all of their games and have Oakland and Seattle lose all remaining games. Even then, they may have had to play tiebreaker games against those teams. However, they had a non-zero chance, and if we want to minimize our guessing error of who makes the playoffs, we should say that, as late as last week, the Indians had a chance of winning it all.
Projecting the odds: how to predict playoffs
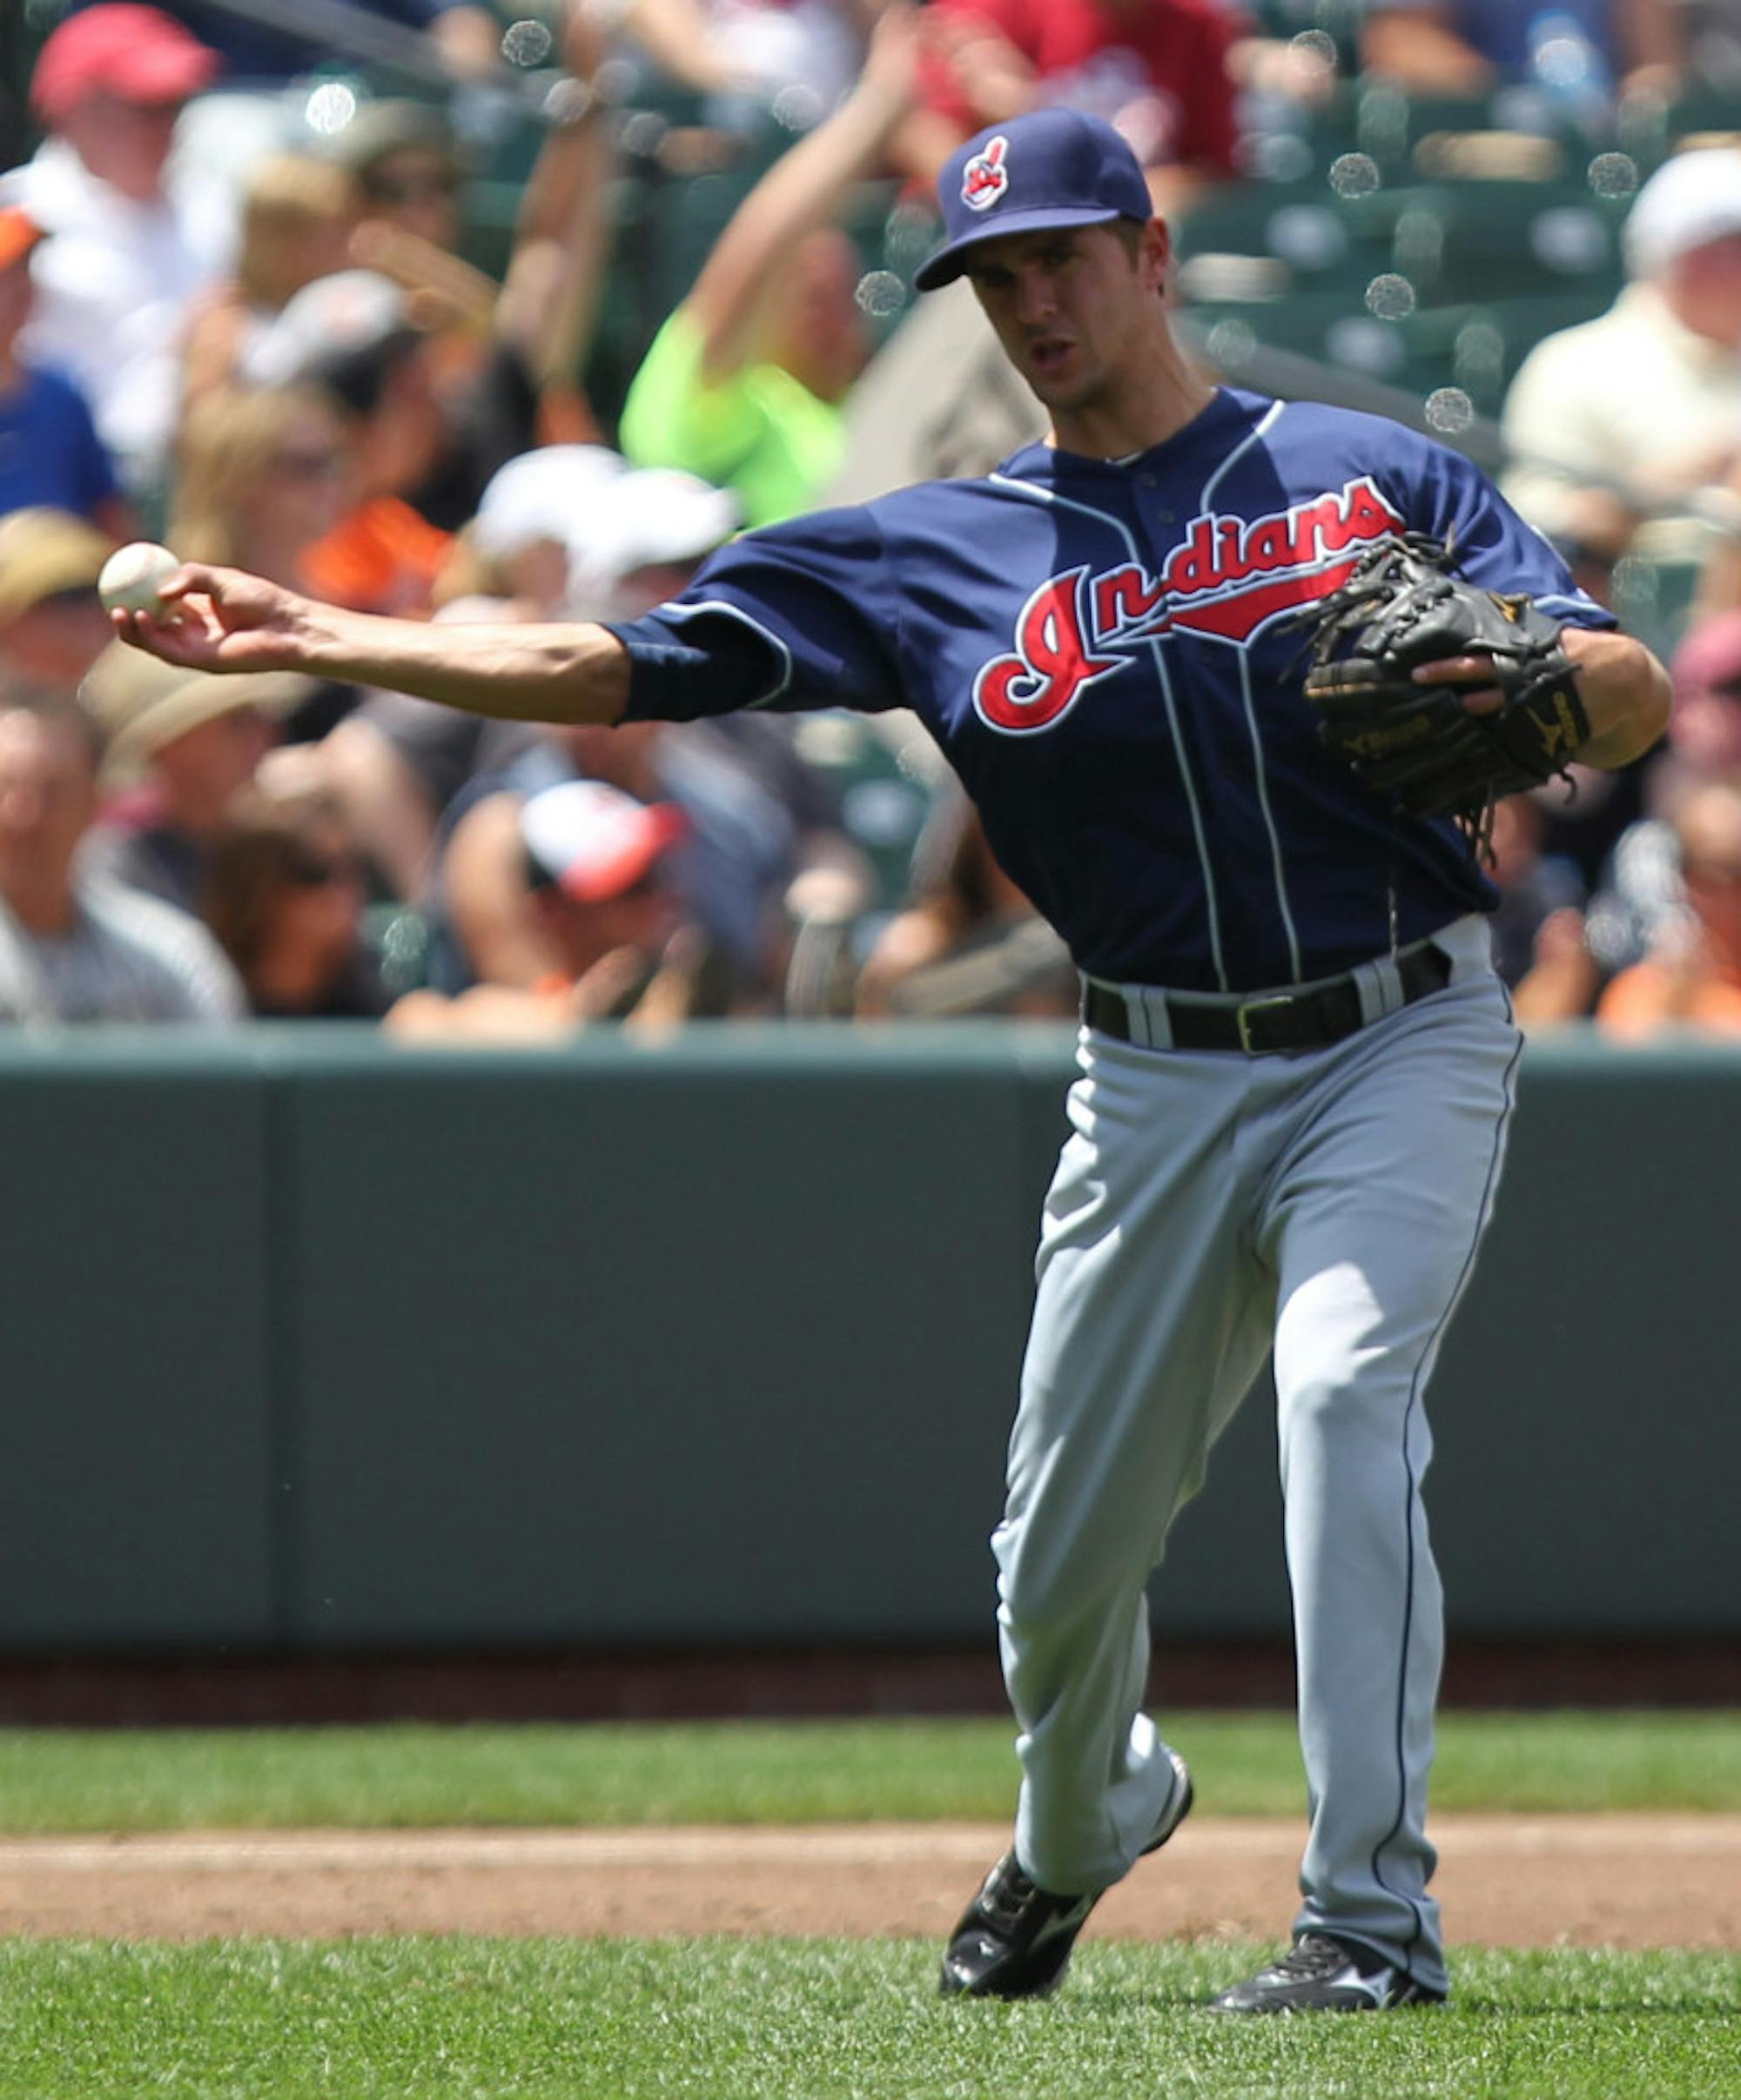
The Cleveland Indians will not be playing in the MLB postseason this year after finishing in the middle of the AL Central.