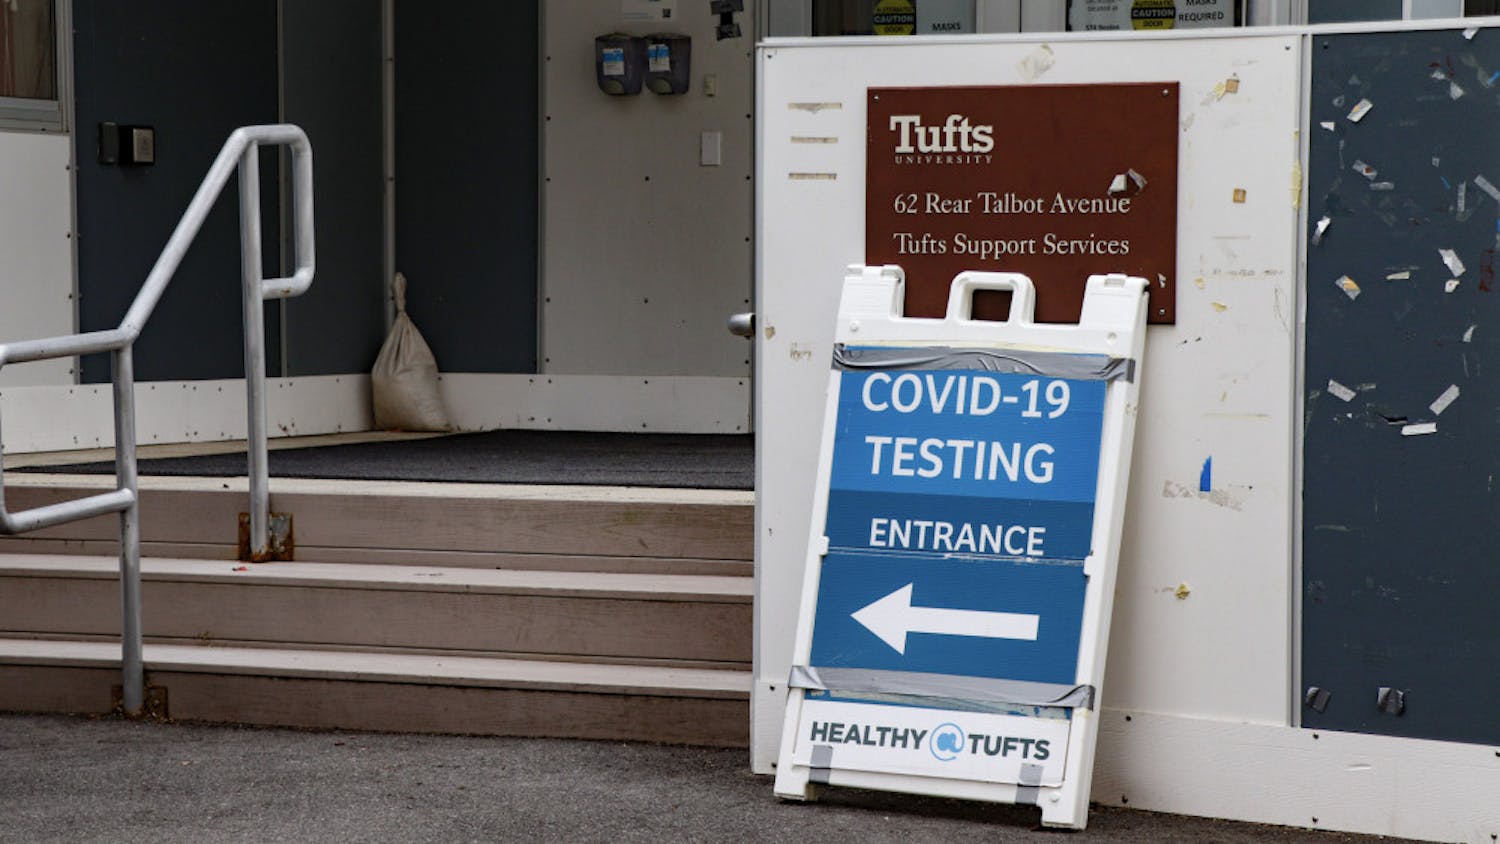
The Daily is engaged in a comprehensive effort to track COVID-19 cases across Tufts' Massachusetts campuses and in their host communities.
We are currently gathering data from Tufts’ campuses and surrounding communities. As of now, we are only visualizing data from the Medford/Somerville campus.
Where do we get our data?
Our data is pulled directly from the Testing Metrics page on Tufts’ coronavirus website, which is updated every day between 4 and 5 p.m. ET. Our dashboard will be updated soon afterward. For external communities, we pull data from a variety of municipal and state websites, as well as The New York Times. These sources are listed in a header cell above each section of our master spreadsheet and are also listed here:
- Tufts' campuses
- Medford
- Somerville
- Grafton
- Boston
- Middlesex, Worcester, Suffolk Counties: nytimes.com personal coronavirus tracker
- Massachusetts: nytimes.com personal coronavirus tracker
How do we calculate our numbers?
New Cases and Tests: The data we pull from Tufts’ dashboard is the cumulative number of unique individuals. To translate this into a day-by-day new case and test metric, we simply find the difference in either cases or tests between the current day and the day before.
Since our daily case and test numbers are taken from the cumulative section of Tufts’ website, they should never be negative. A cumulative count should only go up. A negative number might indicate a reporting error or an adjustment to correct a previous reporting error on the university’s part. We will highlight any of these discrepancies in red.
7-Day Average: This calculation is completed by summing the number of new cases over the previous seven days (including the most recent day) and then dividing by seven. We use this 7-day trailing average for all other calculations instead of a raw new case number, since the 7-day average fluctuates less rapidly than a raw case number.
Per 100k: For the counties and Massachusetts, The New York Times publishes a per 100k estimate. For the other regions, we had to complete our own calculation, which requires an estimate of a locality’s population. Municipalities like Medford, Somerville, Grafton and Boston have a published population count. For the Tufts campuses, we estimated the current campus population by using the total number of unique individuals tested over the past week. Once we had a population estimate, we divided the data point by this population estimate and multiplied by 100,000.
% Change: A daily percent change calculation finds the difference between the two most recent data points and dividing by the older data point before multiplying by 100.
14-Day % Change: A 14-day percent change calculation finds the difference between the most recent data point and the data point from 14 days prior before dividing by the older data point and multiplying by 100.
Why are we doing this project?
Currently, Tufts does not publish collective historical data to track the number of cases on certain days over time. By providing students with this COVID-19 data, we hope to equip students with the information needed to make informed decisions about their health. Along these lines, we’ve added metrics to compare the number of cases at Tufts to those in our surrounding communities.
We encourage members of the Tufts, Medford, Somerville, Boston and Grafton communities to take an in-depth look at our spreadsheet with our numbers and formulas. If you have any questions about how we calculate our data, please contact coviddashboard@tuftsdaily.com.


